
Adapt Team
Use cases
Leadership
Get a Monday morning business snapshot in one prompt

The problem: your numbers are correct and uselessWhat Adapt doesA weekly business review without the prepWhat you need connectedWhy a dashboard does not solve thisFAQWhat should be in a weekly business snapshot?Can AI pull revenue and pipeline from different systems in one answer?How do I get this automatically every Monday?Is the data live or cached?Can it show percentages instead of dollar figures?
Monday morning has a familiar shape for anyone running a company or a function. You want to know five things before your first meeting: is revenue up or down, how many customers are actually paying, who is using the product most, what is in the pipeline, and who signed up last week that somebody should call.
None of those five live in the same place. Revenue is in billing. Subscriptions are in billing but on a different screen. Usage is in the warehouse. Pipeline is in the CRM. Signups are in the product database. So the honest version of "Monday morning snapshot" is usually forty minutes of tab-switching, or a standing request to somebody who then spends their Monday morning doing it for you.
This use case collapses that into a single question.
The problem: your numbers are correct and useless
The issue is not that the data is missing. It is that the data is scattered, and the act of assembling it is expensive enough that it either does not happen weekly or it happens at someone's expense.
A few specific failure modes:
- One question spans four systems. Revenue, subscriptions, usage, and pipeline live in different tools with different definitions of a customer. Joining them by hand is slow and easy to get wrong.
- Dashboards answer yesterday's question. A dashboard is built once for a fixed question. The moment you want a different cut, you either file a ticket or go make a spreadsheet.
- Comparison is the whole point, and it is the hardest part. "Revenue over the last 30 days" is nearly meaningless. "Versus the prior 30" is the number you actually want, and it is the one that takes the longest to produce.
- The follow-up list gets lost. New signups worth chasing are exactly the kind of thing that gets noticed on Thursday, three days after they would have been worth a same-day call.
What Adapt does
In the demo the entire ask is one prompt:
Give me a Monday morning business snapshot: revenue over the last 30 days versus the prior 30, active subscription count, top accounts by product usage, open pipeline, and any companies that signed up in the last week worth following up on.
Adapt then does the assembly:
- Recognizes the recurring job. It matches the request to a saved skill, so the same snapshot is produced the same way every week rather than reinvented each time.
- Runs a live pull. The numbers come from the source systems at the moment you ask, timestamped, not from a cached dashboard that may be a day stale.
- Builds the comparison. Revenue for the last 30 days is indexed against the prior 30, so the output leads with the change rather than an absolute you have to interpret.
- Splits the drivers. In the demo, cash collected, consumption value delivered, consumption on a target account, and consumption across all other customers each get their own line, because a single blended number would hide the thing worth knowing.
- Adds the operational counts. Active subscriptions, past due, trialing.
- Ranks accounts by real usage, not by contract size, using human message volume over the last 30 days.
- Flags the follow-ups. New signups from the last week, described so you know who to call.
The output reads like a analyst's note rather than a dashboard. It includes caveats where the data warrants them, for example warning you not to quote a soft-looking index as a real decline when the underlying period is short.
A weekly business review without the prep
Said another way: this is the executive weekly review, generated on demand, from live data, in the time it takes to read it.
Because it runs off a saved skill, it is also repeatable. The same prompt on the following Monday produces the same shape of answer with new numbers, which is what makes it comparable week to week. And because it is a chat rather than a dashboard, the follow-up question is free. "Why is consumption down on everyone except the target account?" is just the next message.
The same workflow can run on a schedule and post itself into Slack before you wake up, which is how most teams end up using it after the first month.
What you need connected
- Billing, for revenue and subscription state. Stripe in this demo.
- Your warehouse or product database, for usage and signups. BigQuery, Snowflake, Postgres, or similar.
- Your CRM, for open pipeline. HubSpot, Salesforce, Attio, or Pipedrive.
- Slack, if you want the snapshot delivered rather than requested.
Why a dashboard does not solve this
Dashboards are excellent at the question you already knew you had. They are poor at the question you have this week. Every new cut is a small project, so over time the dashboard drifts from what leadership actually asks, and the gap gets filled by someone building a spreadsheet at 8am on Monday.
An AI coworker inverts that. The question is the interface. The joins across billing, warehouse, and CRM happen at query time, the comparison period is whatever you say it is, and the caveats come with the answer instead of being lost in a footnote nobody reads.
FAQ
What should be in a weekly business snapshot?
At minimum: revenue for the period against the prior period, active subscription or customer count, top accounts by product usage, open pipeline, and new signups worth a follow-up. The comparison to the prior period matters more than any single absolute number.
Can AI pull revenue and pipeline from different systems in one answer?
Yes. An AI agent connected to your billing system, warehouse, and CRM can query all three and join the results in one response. That cross-system join is the part a single-tool dashboard cannot do.
How do I get this automatically every Monday?
Save it as a recurring automation. The same prompt runs on a schedule and delivers the result to Slack or email before the week starts, so nobody has to remember to ask.
Is the data live or cached?
Live. The agent queries the source systems when you ask and timestamps the pull, so you are reading the state of the business at that moment rather than a dashboard refresh from last night.
Can it show percentages instead of dollar figures?
Yes. In this demo every revenue and pipeline figure is indexed to 100 against the prior period, which is also a useful way to share a snapshot outside the finance team without exposing raw numbers.
Want your own Monday snapshot wired to your systems? Book a session with an Adapt engineer.
More use cases
1:52
Getting started4 min read
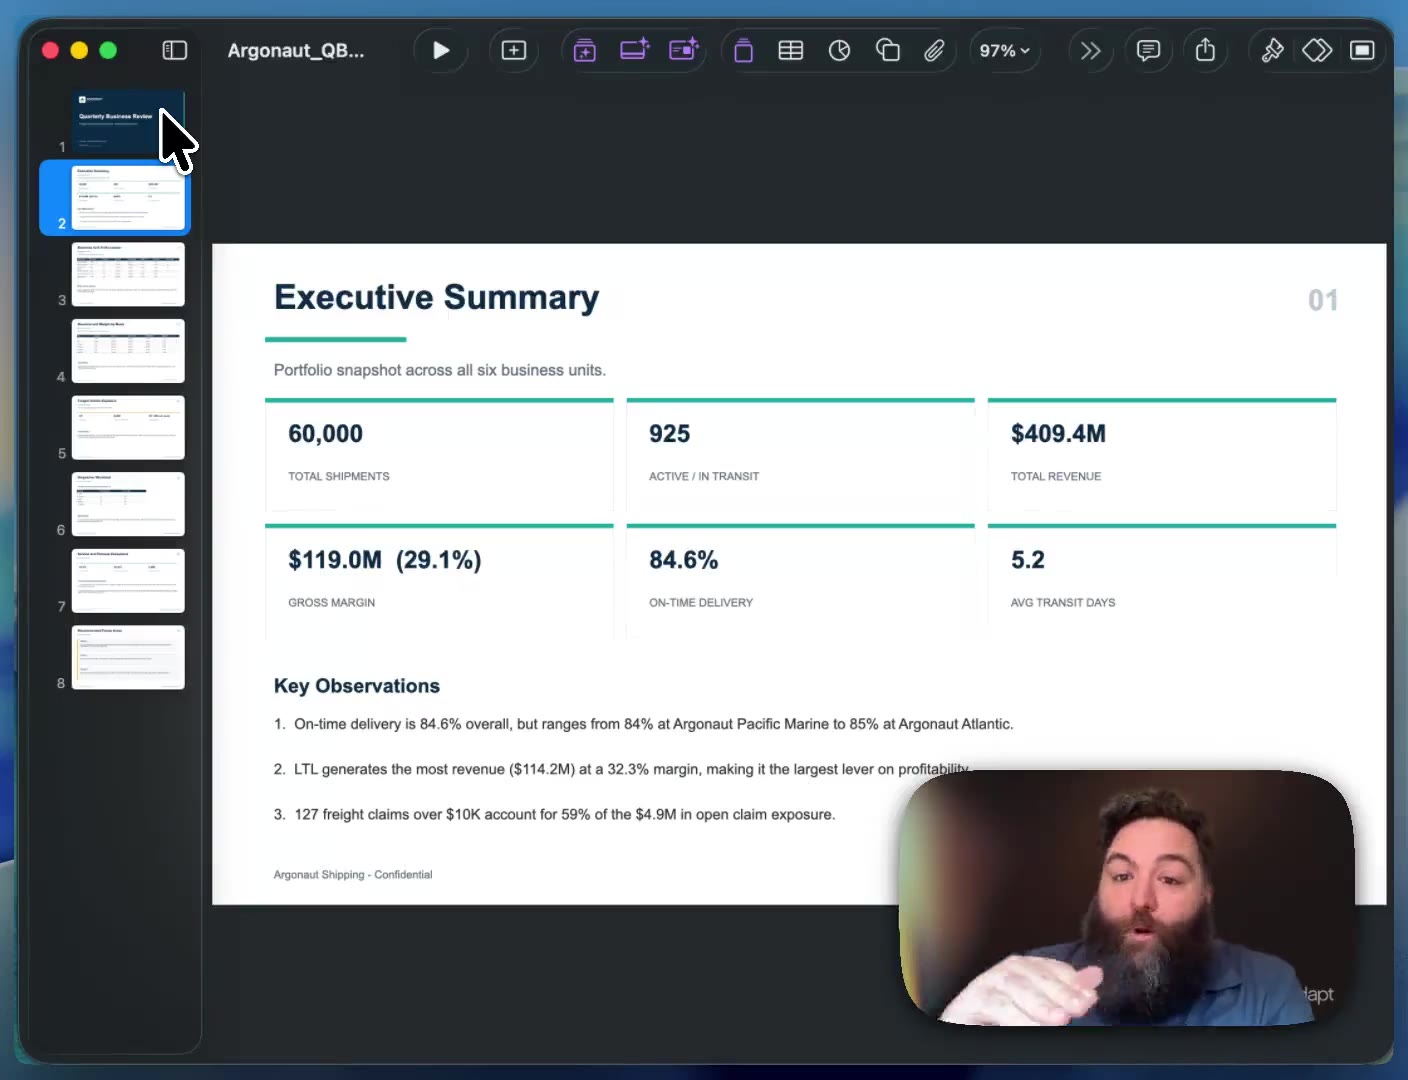
Upload one file and get a finished QBR deck back
No integrations, no setup, no connectors. Drag in a raw export, describe the deck you need, and get a filled quarterly business review built from your own numbers.
2:58
Marketing5 min read
Go from ad idea to finished social video in one thread
A rough concept, a few rounds of feedback, and a rendered social video with real performance data in it. No brief, no agency, no handoff between five tools.
1:47
Customer Success5 min read
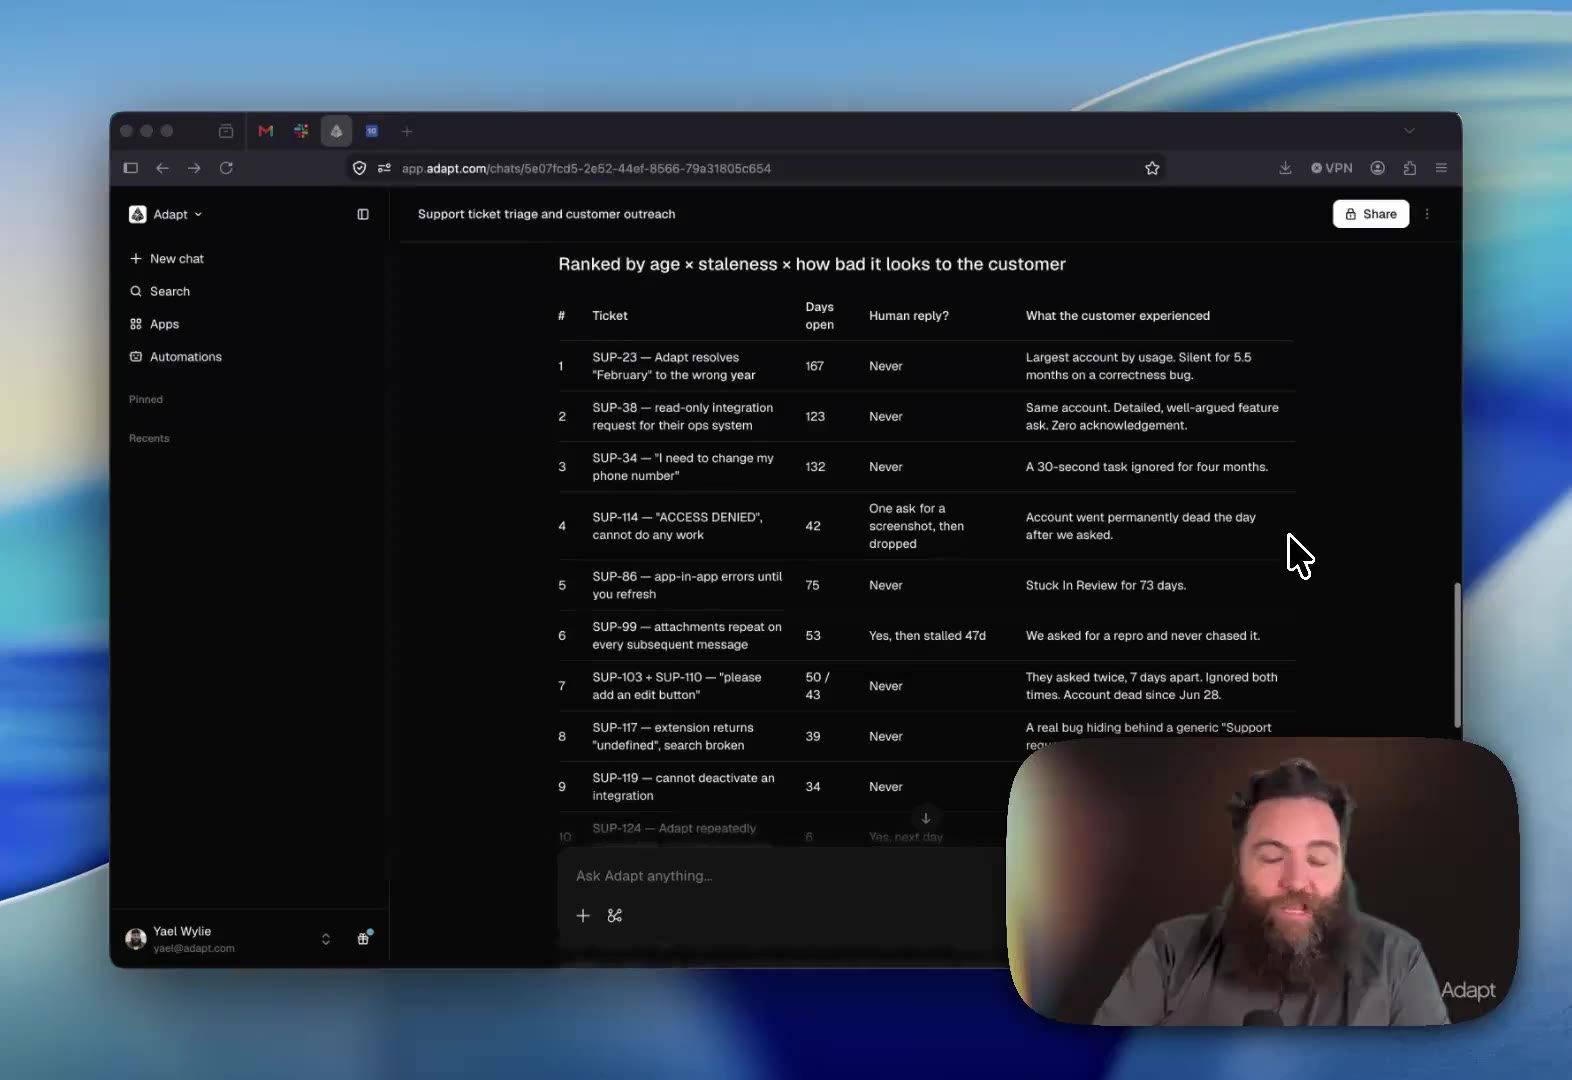
Triage a support queue and find the tickets nobody filed
Your support backlog is only half the problem. The other half is sitting in shared Slack channels as messages nobody answered. Here is how an AI coworker ranks both, and drafts the replies.

Make your company
instantly AI native.
Bring us a priority or workflow. We’ll show you how Adapt can put it to work across your company.