Getting Started
Sign In
- Go to app.adapt.com
- Sign in with Google OAuth or your email/password
- Select your organization (or create a new one)
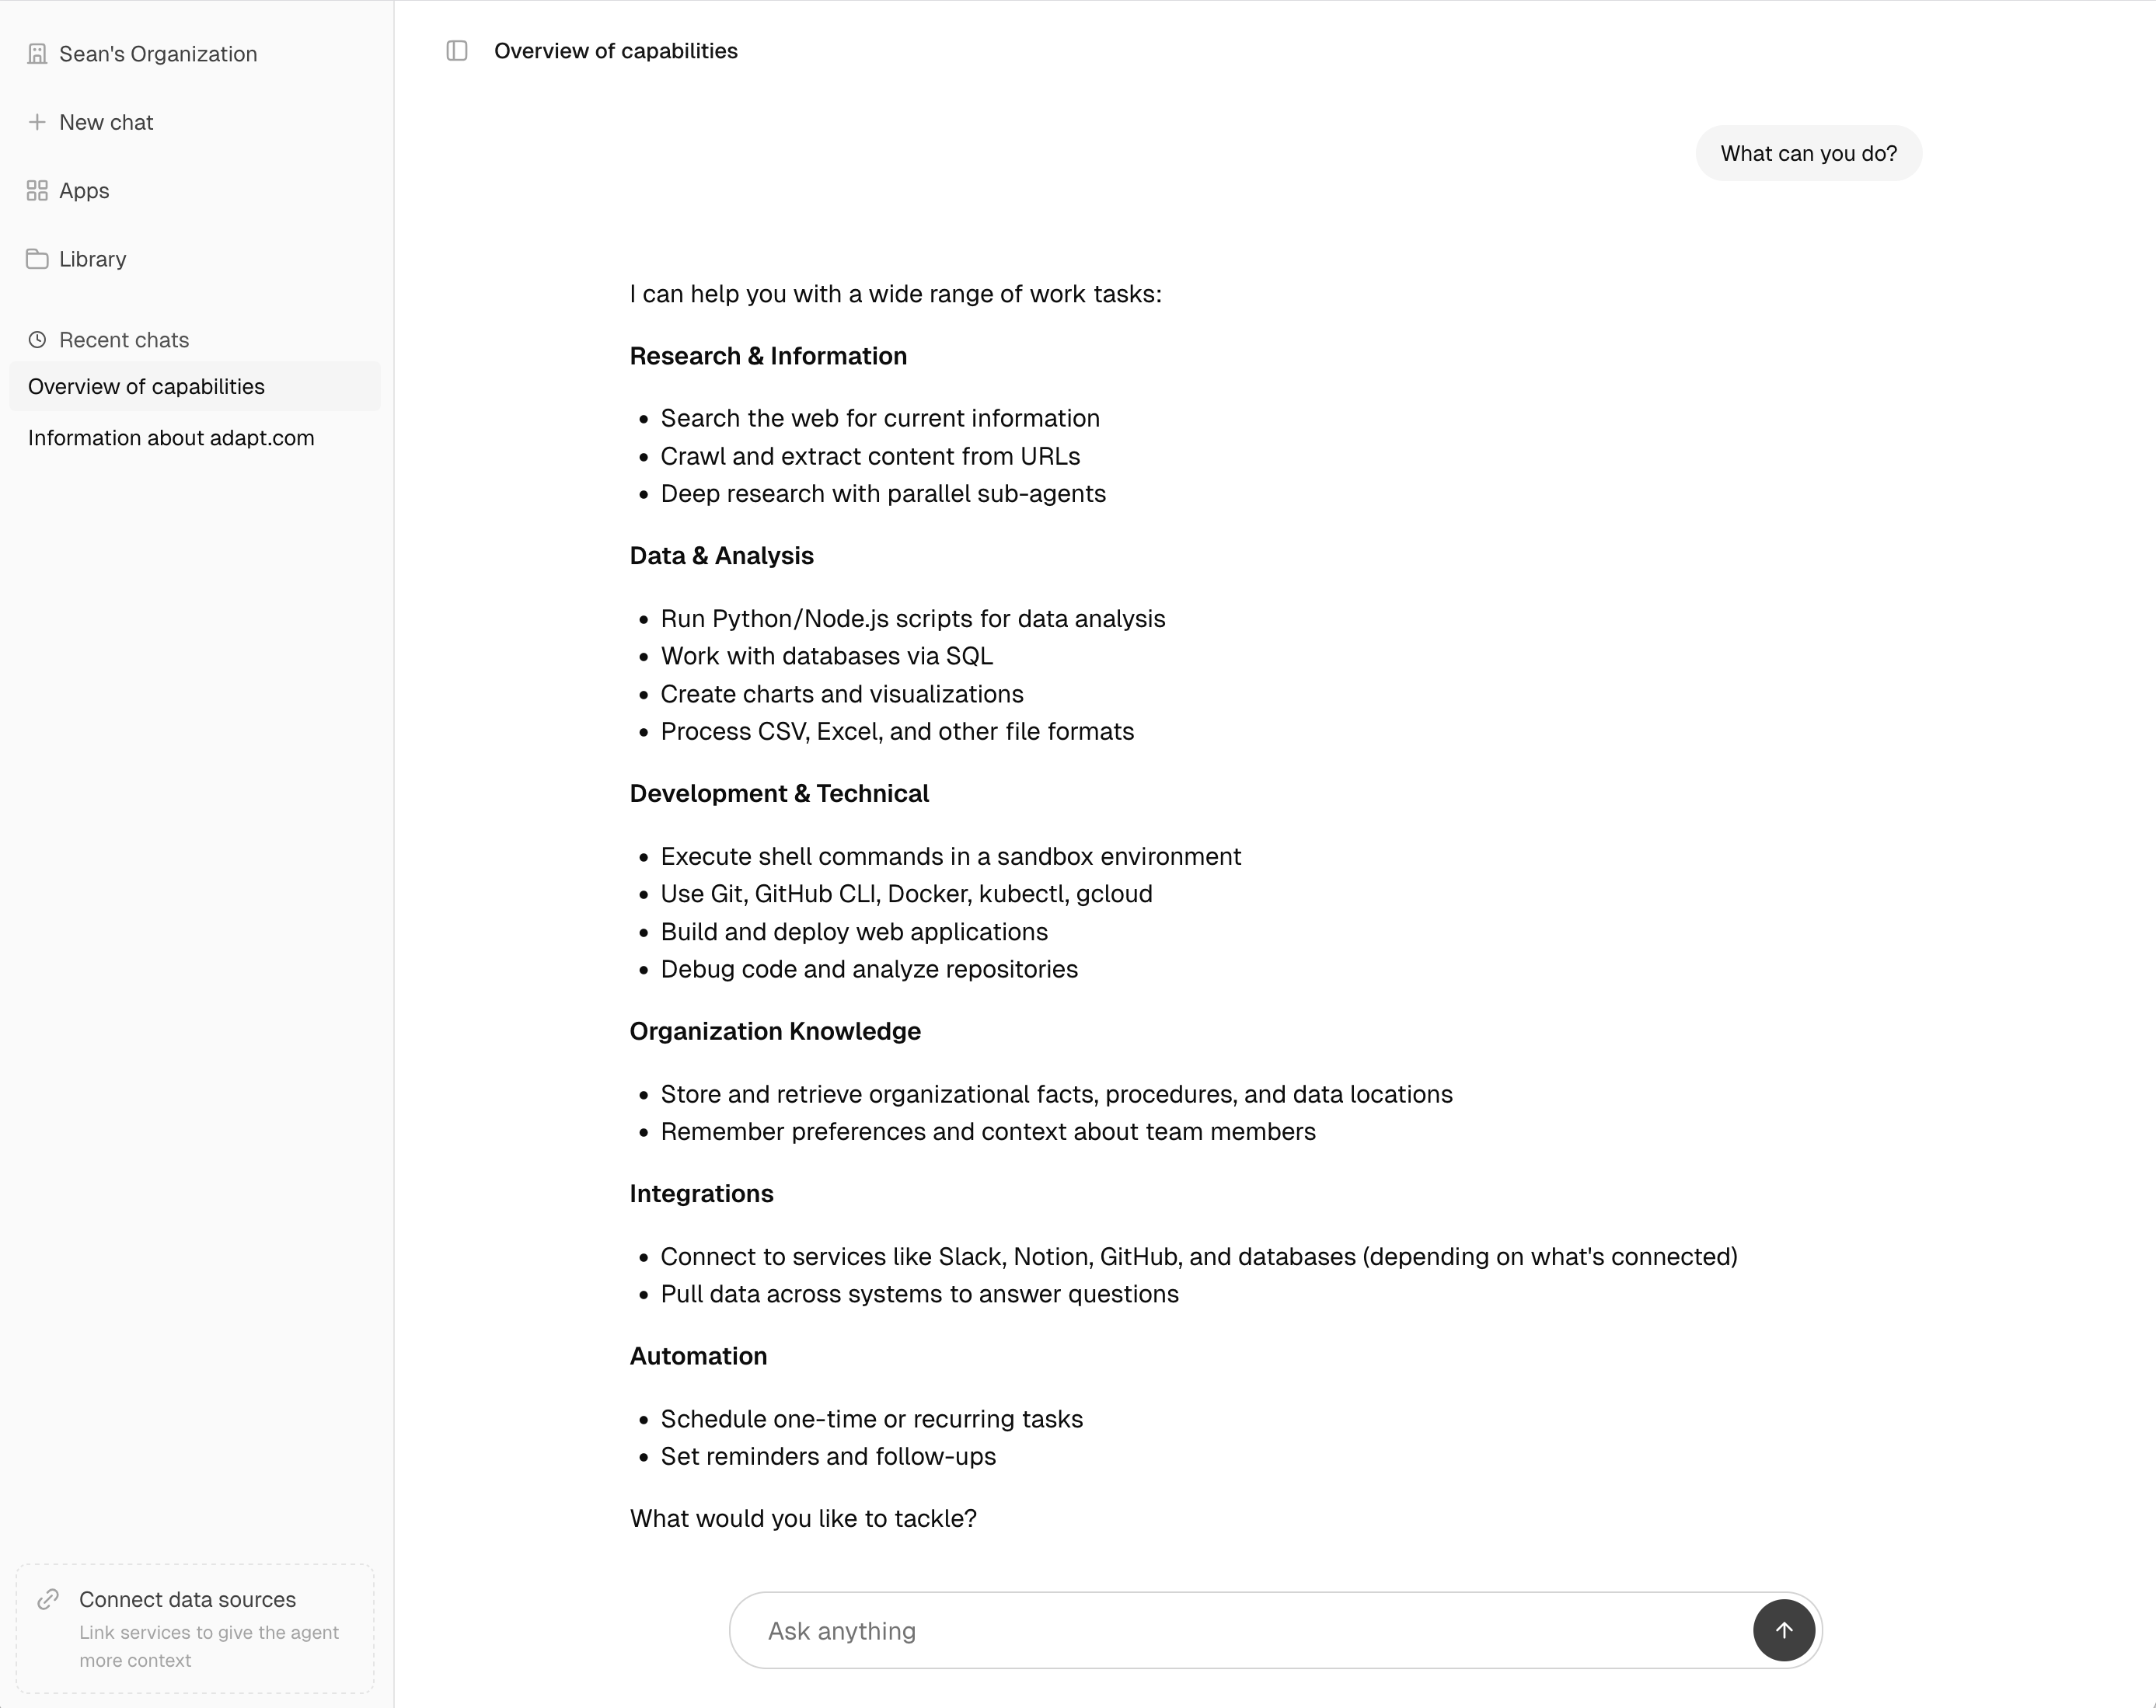
Interface Overview
The web app has two main areas:- Sidebar: Navigation, conversation history, and two menus for settings — a workspace menu at the top for your organization and a user menu at the bottom for your personal settings and support
- Chat area: Your conversation with Adapt
Sidebar Menus
Two menus in the sidebar hold everything outside your chats:- Workspace menu — click your organization name at the top to switch organizations and open any org page: General settings, Members, Groups, Integrations, Policies, Knowledge, Skills, and Usage.
- User menu — click your name and avatar at the bottom for your personal settings (Account, Preferences, Authentication, Invites), Support, and Log out.
Browser Tab Titles
Every page names itself in the browser tab, so a row of open Adapt tabs is scannable at a glance. Titles run most specific first, then the section, then Adapt: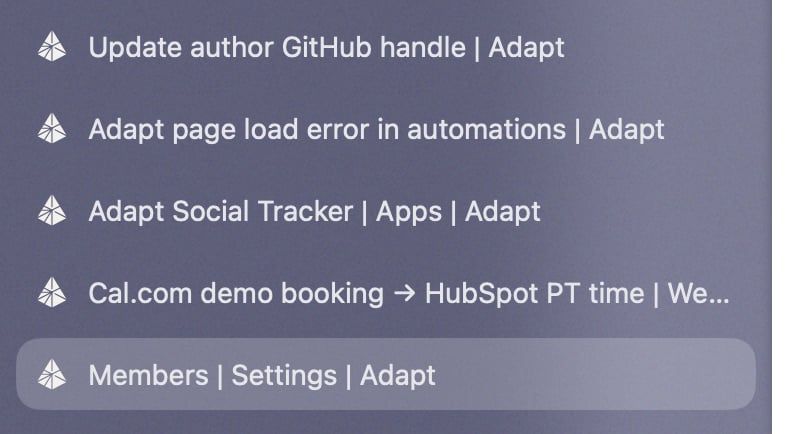
Chats skip the section segment so the chat name gets the full width. The title updates live when a chat is auto-titled or renamed, and long names are truncated so one title can’t swamp the tab strip. The same titles carry into bookmarks, history, and window switchers.
Chat Interface
Starting a Conversation
Click New Chat to start a new conversation. Type your question naturally:Draft Messages
Adapt saves whatever you’ve typed in the composer and restores it when you return to a conversation. Each chat keeps its own draft, and the new-chat composer keeps its own too, so you can start a message, navigate away, and pick it back up later. Drafts are saved automatically as you type, are cleared once you send the message, and are stored locally in your browser.Message Features
Chat Menu
Open the chat menu from the three dots next to a chat in the sidebar or the same menu in the title bar. The menu is identical in both places and includes:- Pin to keep a chat at the top of the sidebar
- Rename the chat
- Copy all messages as Markdown to your clipboard
- Download as Markdown to save the conversation as a
.mdfile - Delete the chat
Exporting a Chat
Both Copy all messages and Download as Markdown produce the same content — the full conversation as Markdown with:- Every message labeled with author and timestamp
- Attachments listed inline with filenames
- Tool calls and tool results preserved as fenced code blocks
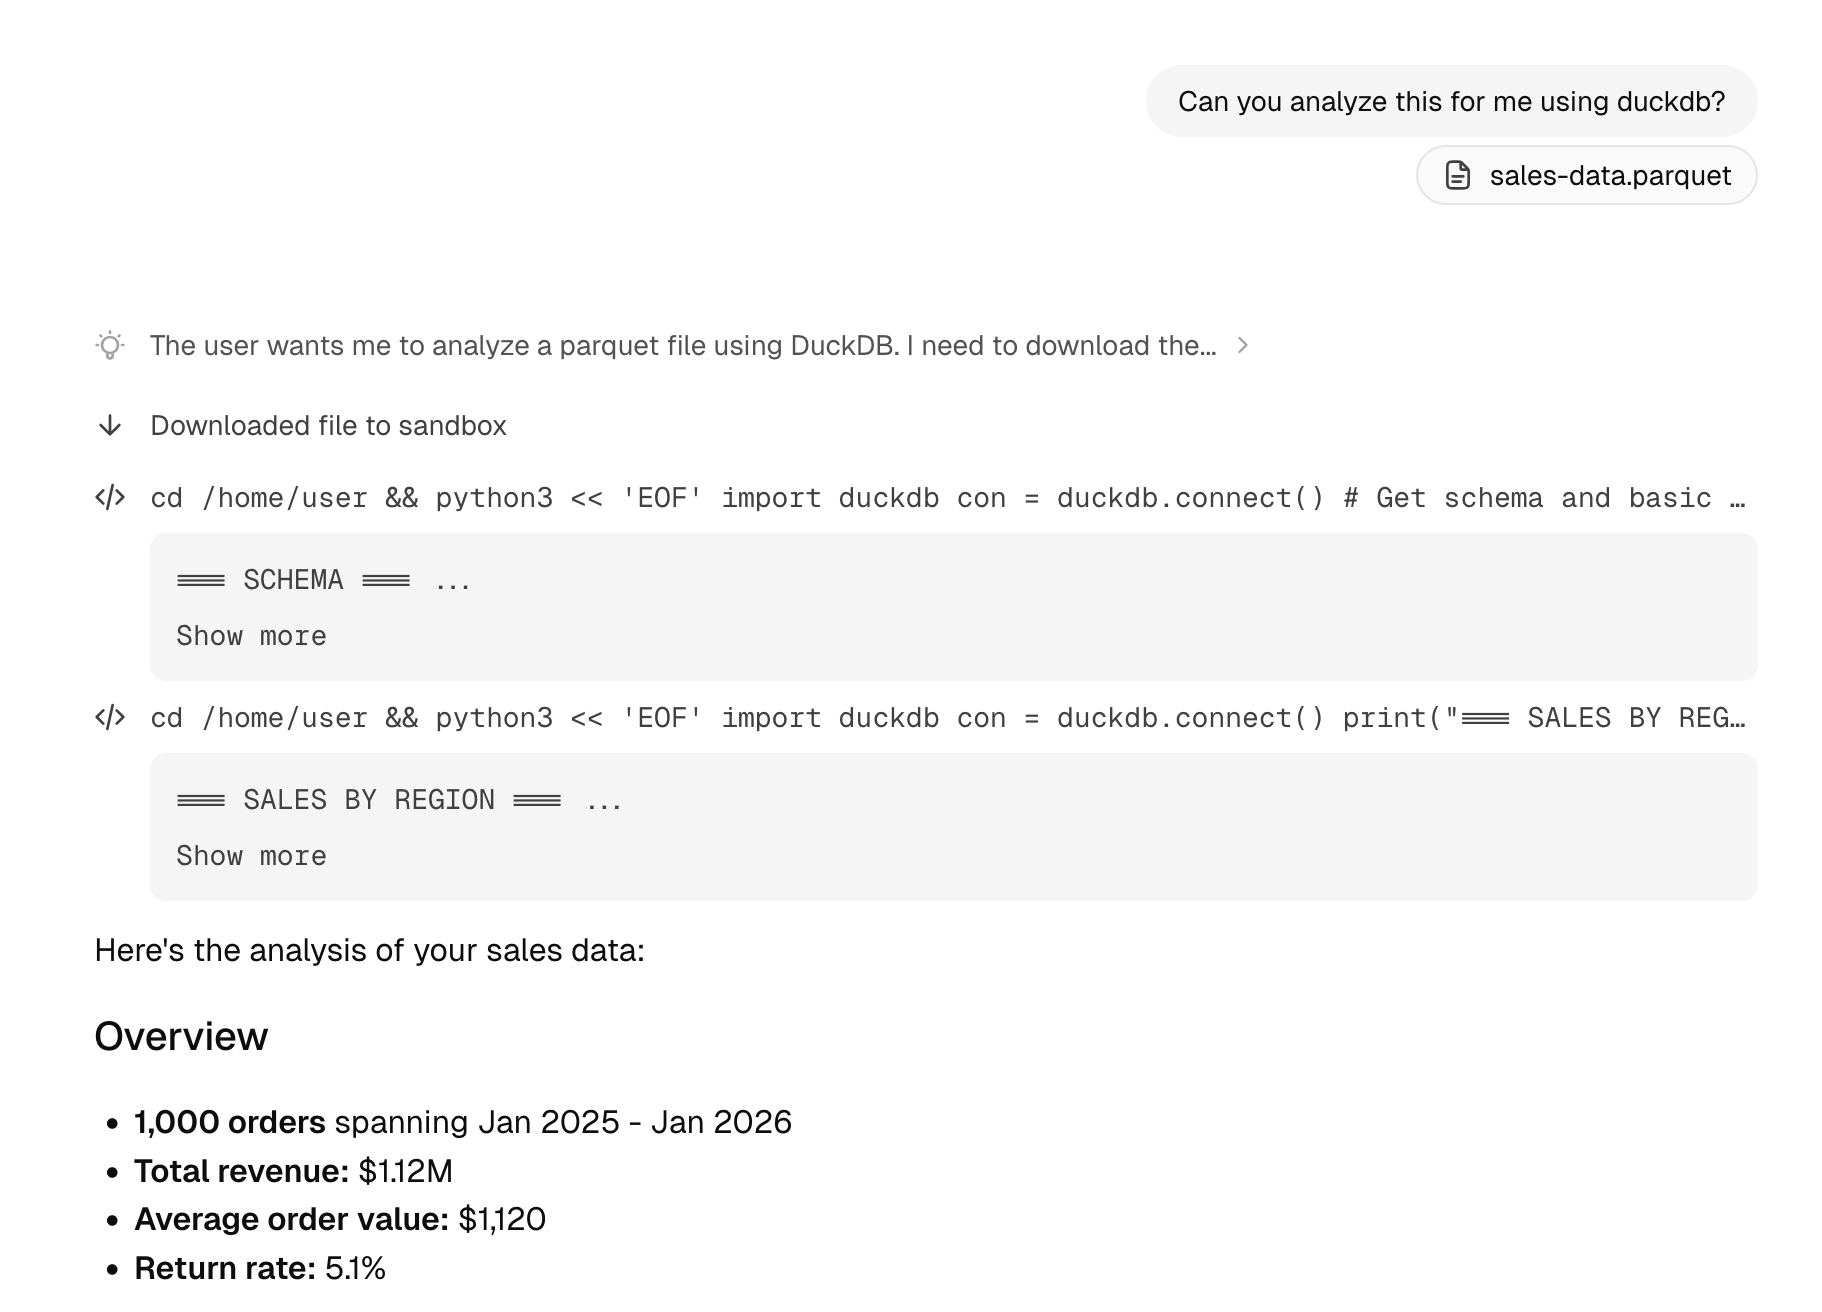
File Attachments
Attach files to your messages for analysis:- CSV/Parquet/JSON/Excel: Upload files for data analysis
- PDF: Share documents for summarization or extraction
- Images: Include screenshots or charts for discussion, or ask Adapt to edit, restyle, composite, or transform them
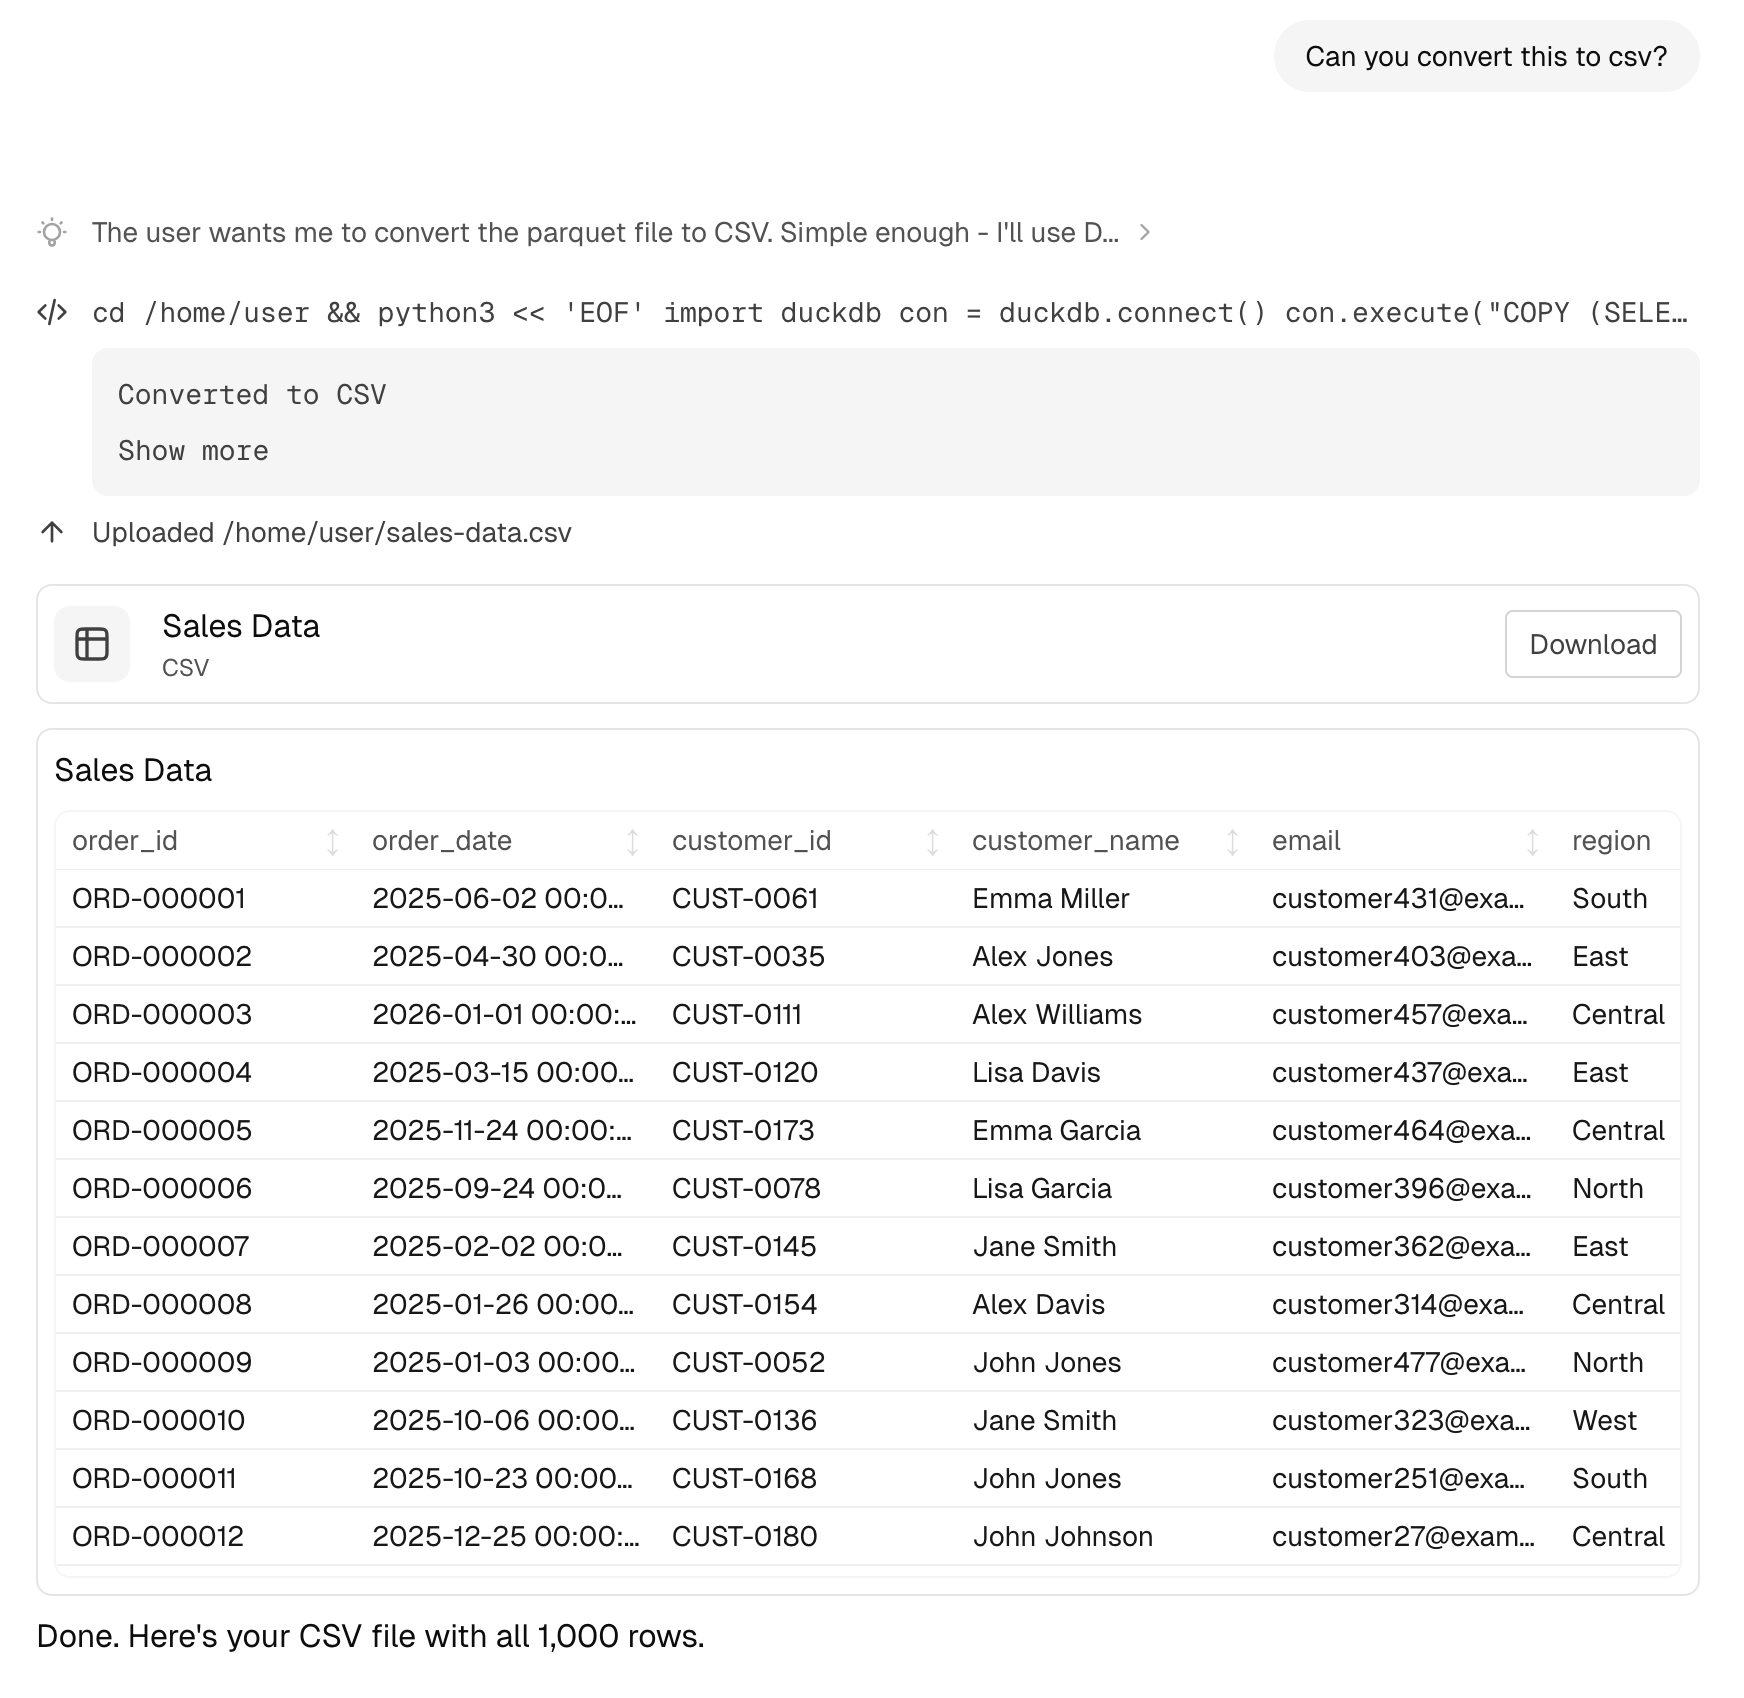
Rich Outputs
Adapt can generate various types of rich content.Tables
Data is automatically formatted into interactive tables:- Sort by clicking column headers
- Search within the table
- Export to CSV
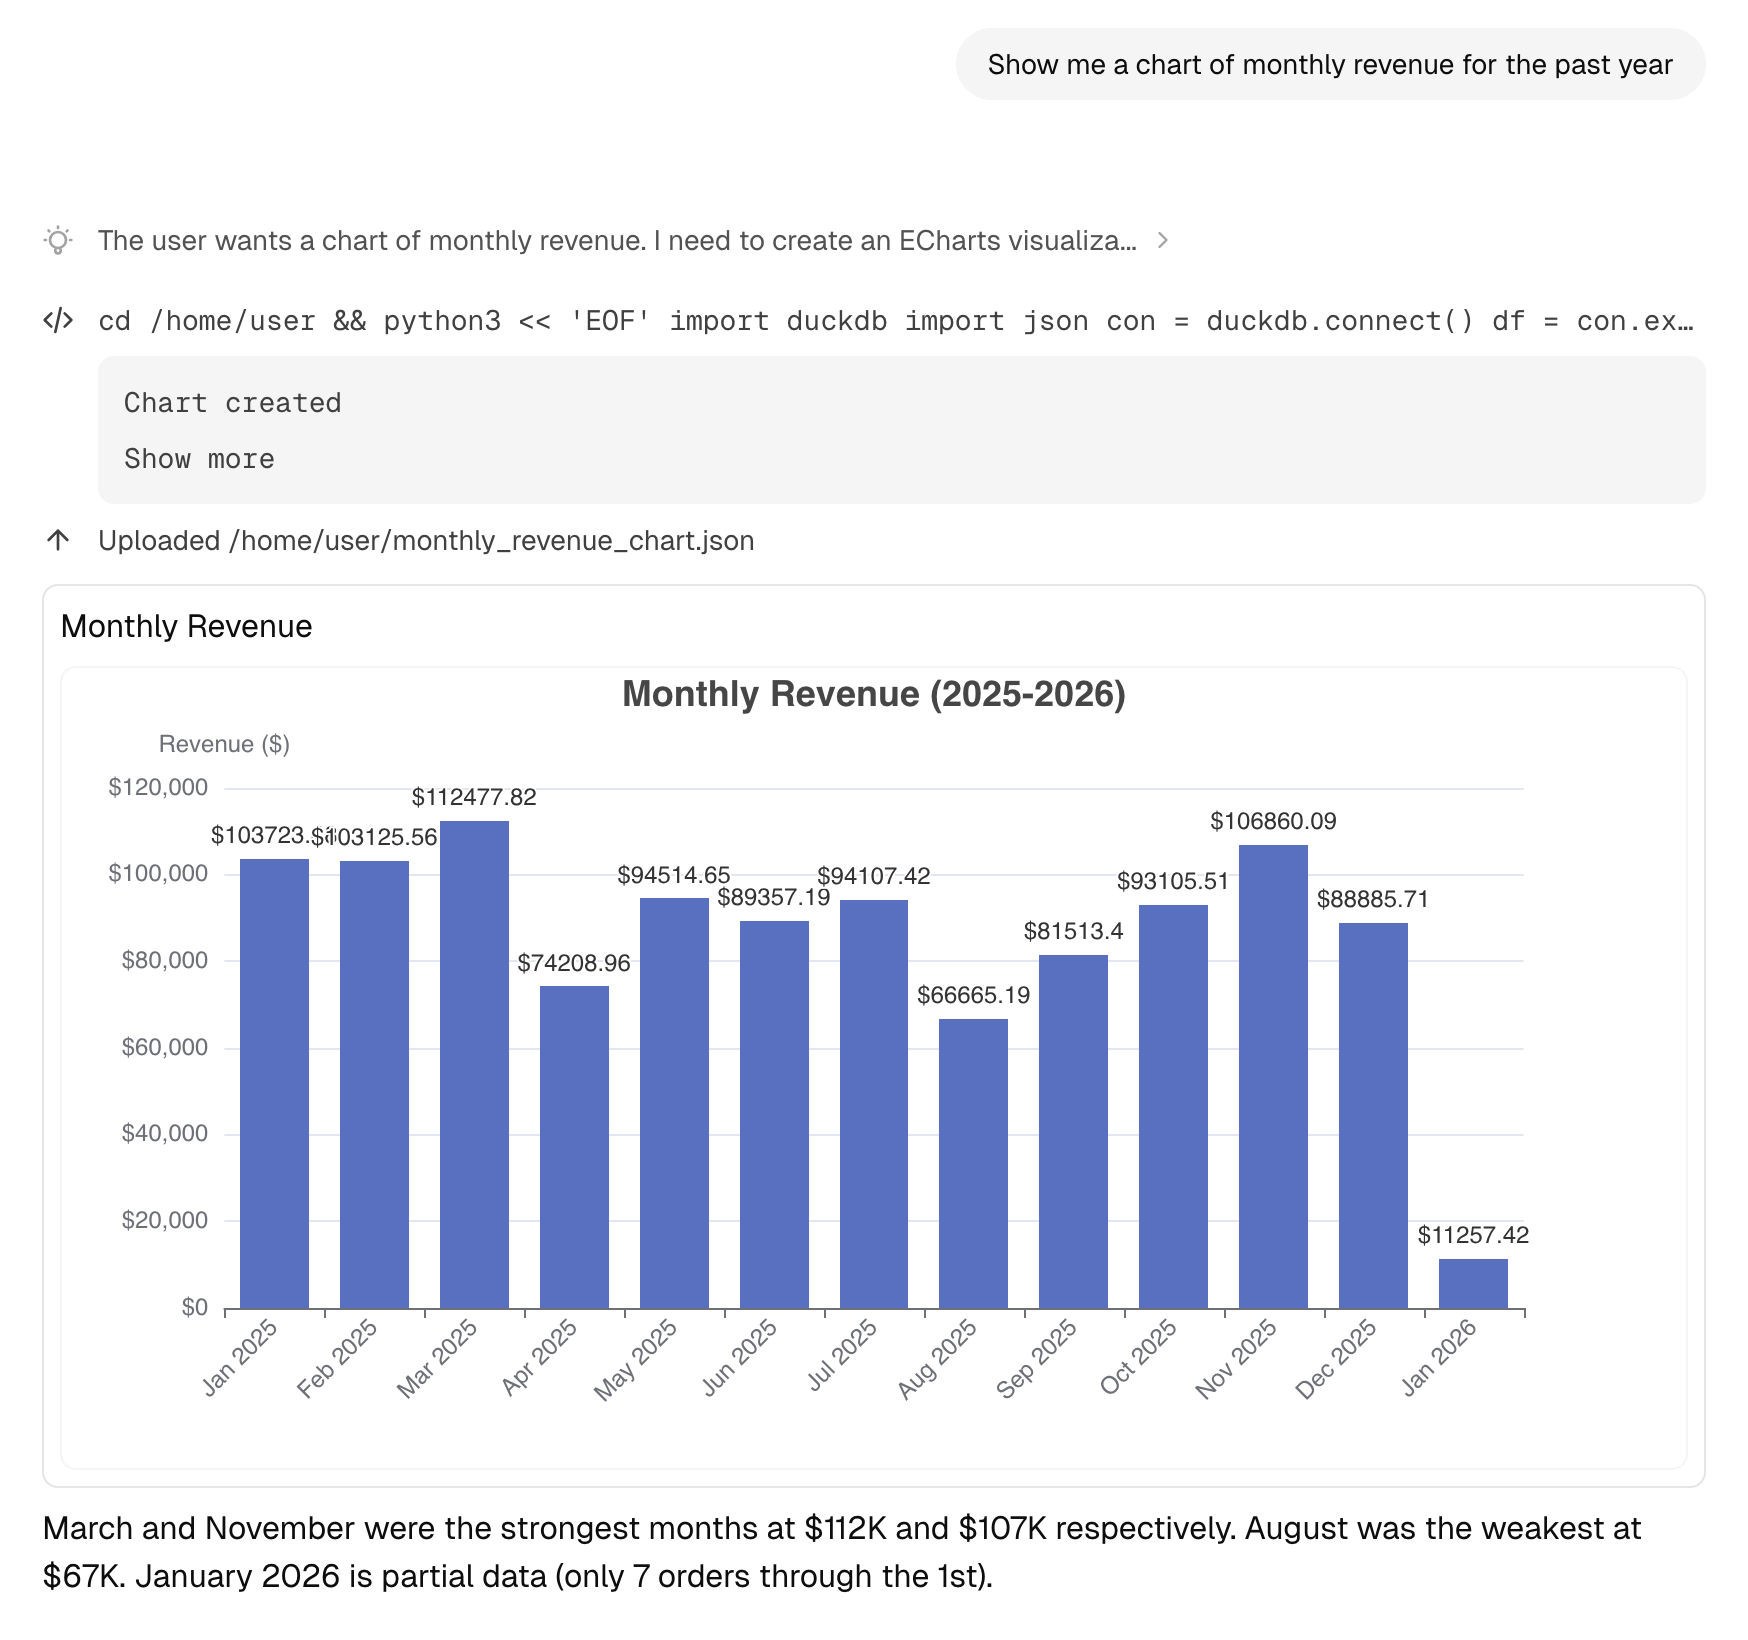
Charts
Request visualizations and Adapt will generate interactive charts. Chart types include:- Line charts for trends
- Bar charts for comparisons
- Pie charts for distributions
- Area charts for cumulative data
Code Execution
When Adapt runs code, you’ll see:- The code that was executed
- Output and results
- Any generated files or visualizations
Images
Adapt can generate images from a prompt or edit images you upload, using a flagship image model that’s continually upgraded as the space evolves. Ask for a brand-new visual or transform an attached image:1:1, 3:4, 4:3, 9:16, 16:9, 2:3, 3:2, 21:9. Edits inherit the source image’s aspect ratio.
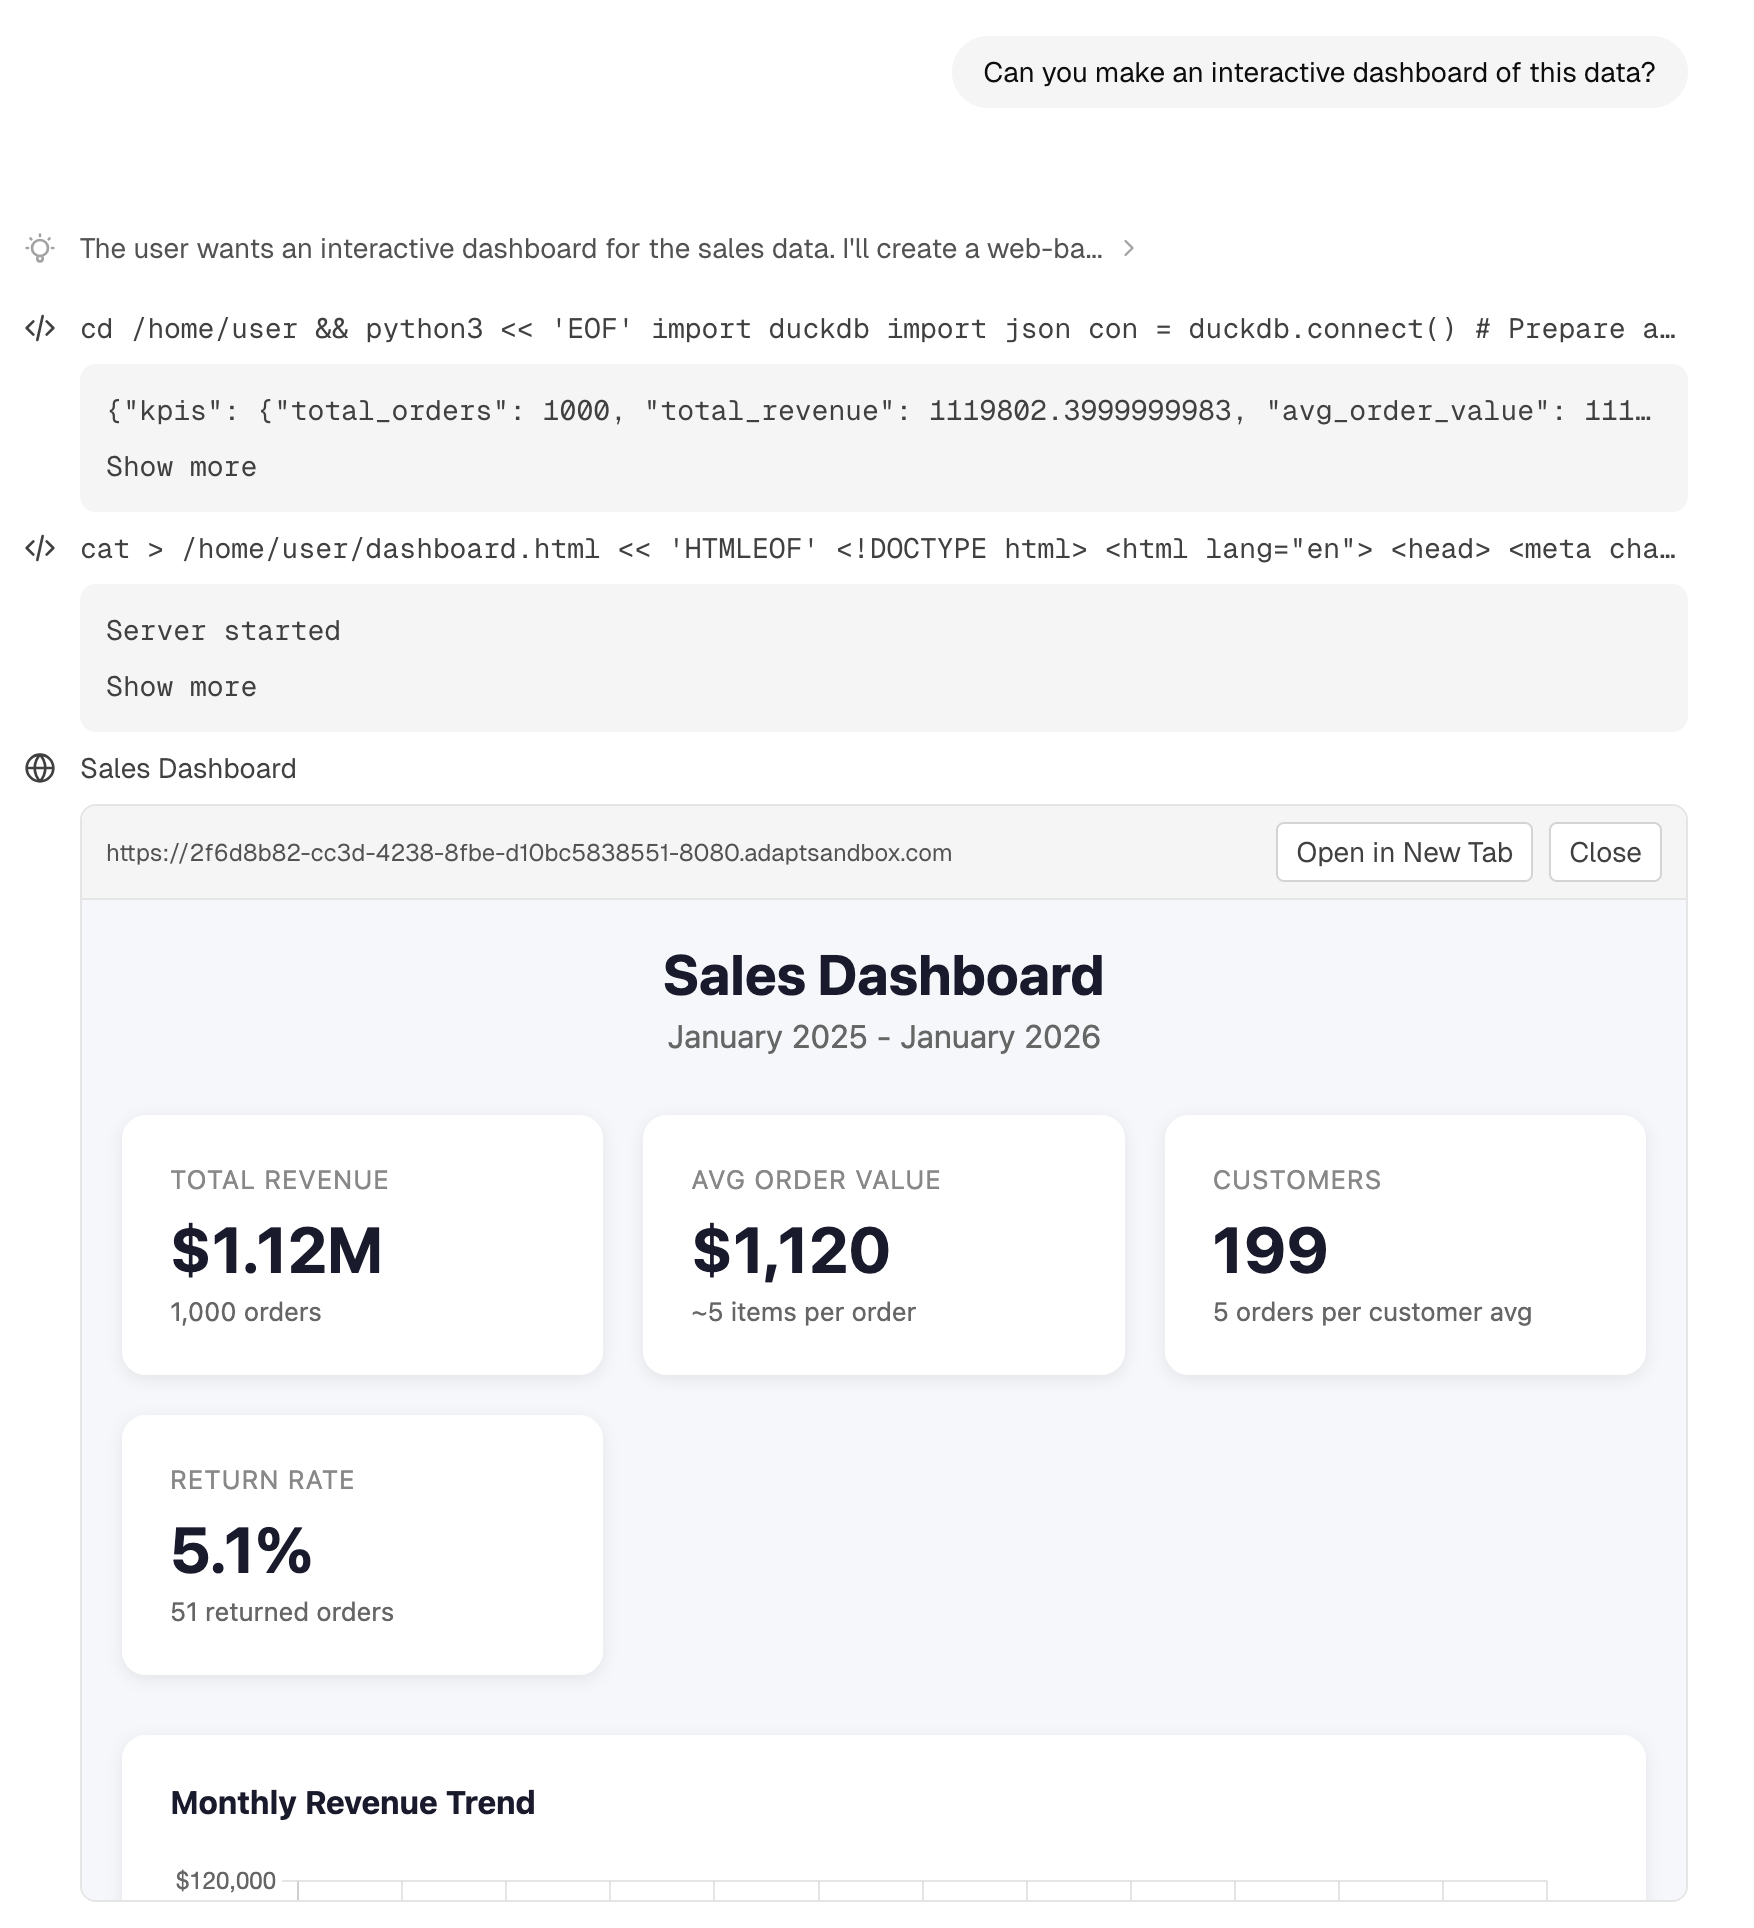
Web Apps
Adapt can generate interactive web apps to visualize and explore your data:- Dashboards with multiple views
- Interactive filters and controls
- Shareable with your team
Organization Settings
Open the workspace menu from your organization name at the top of the sidebar to reach organization settings.Logo
Give Adapt your brand. On the General settings page, click the tile next to Logo and pick a JPEG, PNG, or WebP image up to 5MB. Your logo replaces the default mark next to your organization name at the top of the sidebar for everyone in the organization. There’s no crop step — Adapt bounds the image to 256px on its longest side and preserves its aspect ratio, so wordmark-shaped logos stay wide. Transparent backgrounds are preserved. Owners and admins can upload or remove the logo; the trash icon next to the tile restores the default.Integrations
Connect your tools:- Data warehouses (Snowflake, Databricks)
- Business tools (HubSpot, Stripe, Intercom)
- Communication (Slack)
Team Management
- Invite new members by email
- Manage member roles
- View pending invitations
Billing
- View current usage
- Manage payment methods
- Download invoices
Getting Help
Open Support from the user menu at the bottom of the sidebar whenever you need help. The submenu brings everything together in one place:- System status — a pill at the top shows live status and links to the status page. During an incident, it surfaces the active incident directly.
- Open a case — click New case, add a subject and description, and submit. The Adapt team replies by email.
- Quick links — jump to Documentation, Email Support (pre-filled with your organization details), and the Status Page.
- Slack Connect — if you have the Slack integration connected, request a shared Slack Connect channel to work alongside the Adapt team.
- Talk to sales — book a call with the sales team for pricing questions.
Next Steps
Slack App
Use Adapt directly in Slack
Connect Integrations
Link your data sources