


Automations run while you're not watching, which makes them the easiest place for credits to disappear quietly. Now every automation reports what it costs — in the list, on its own page, and per individual run.
In the list
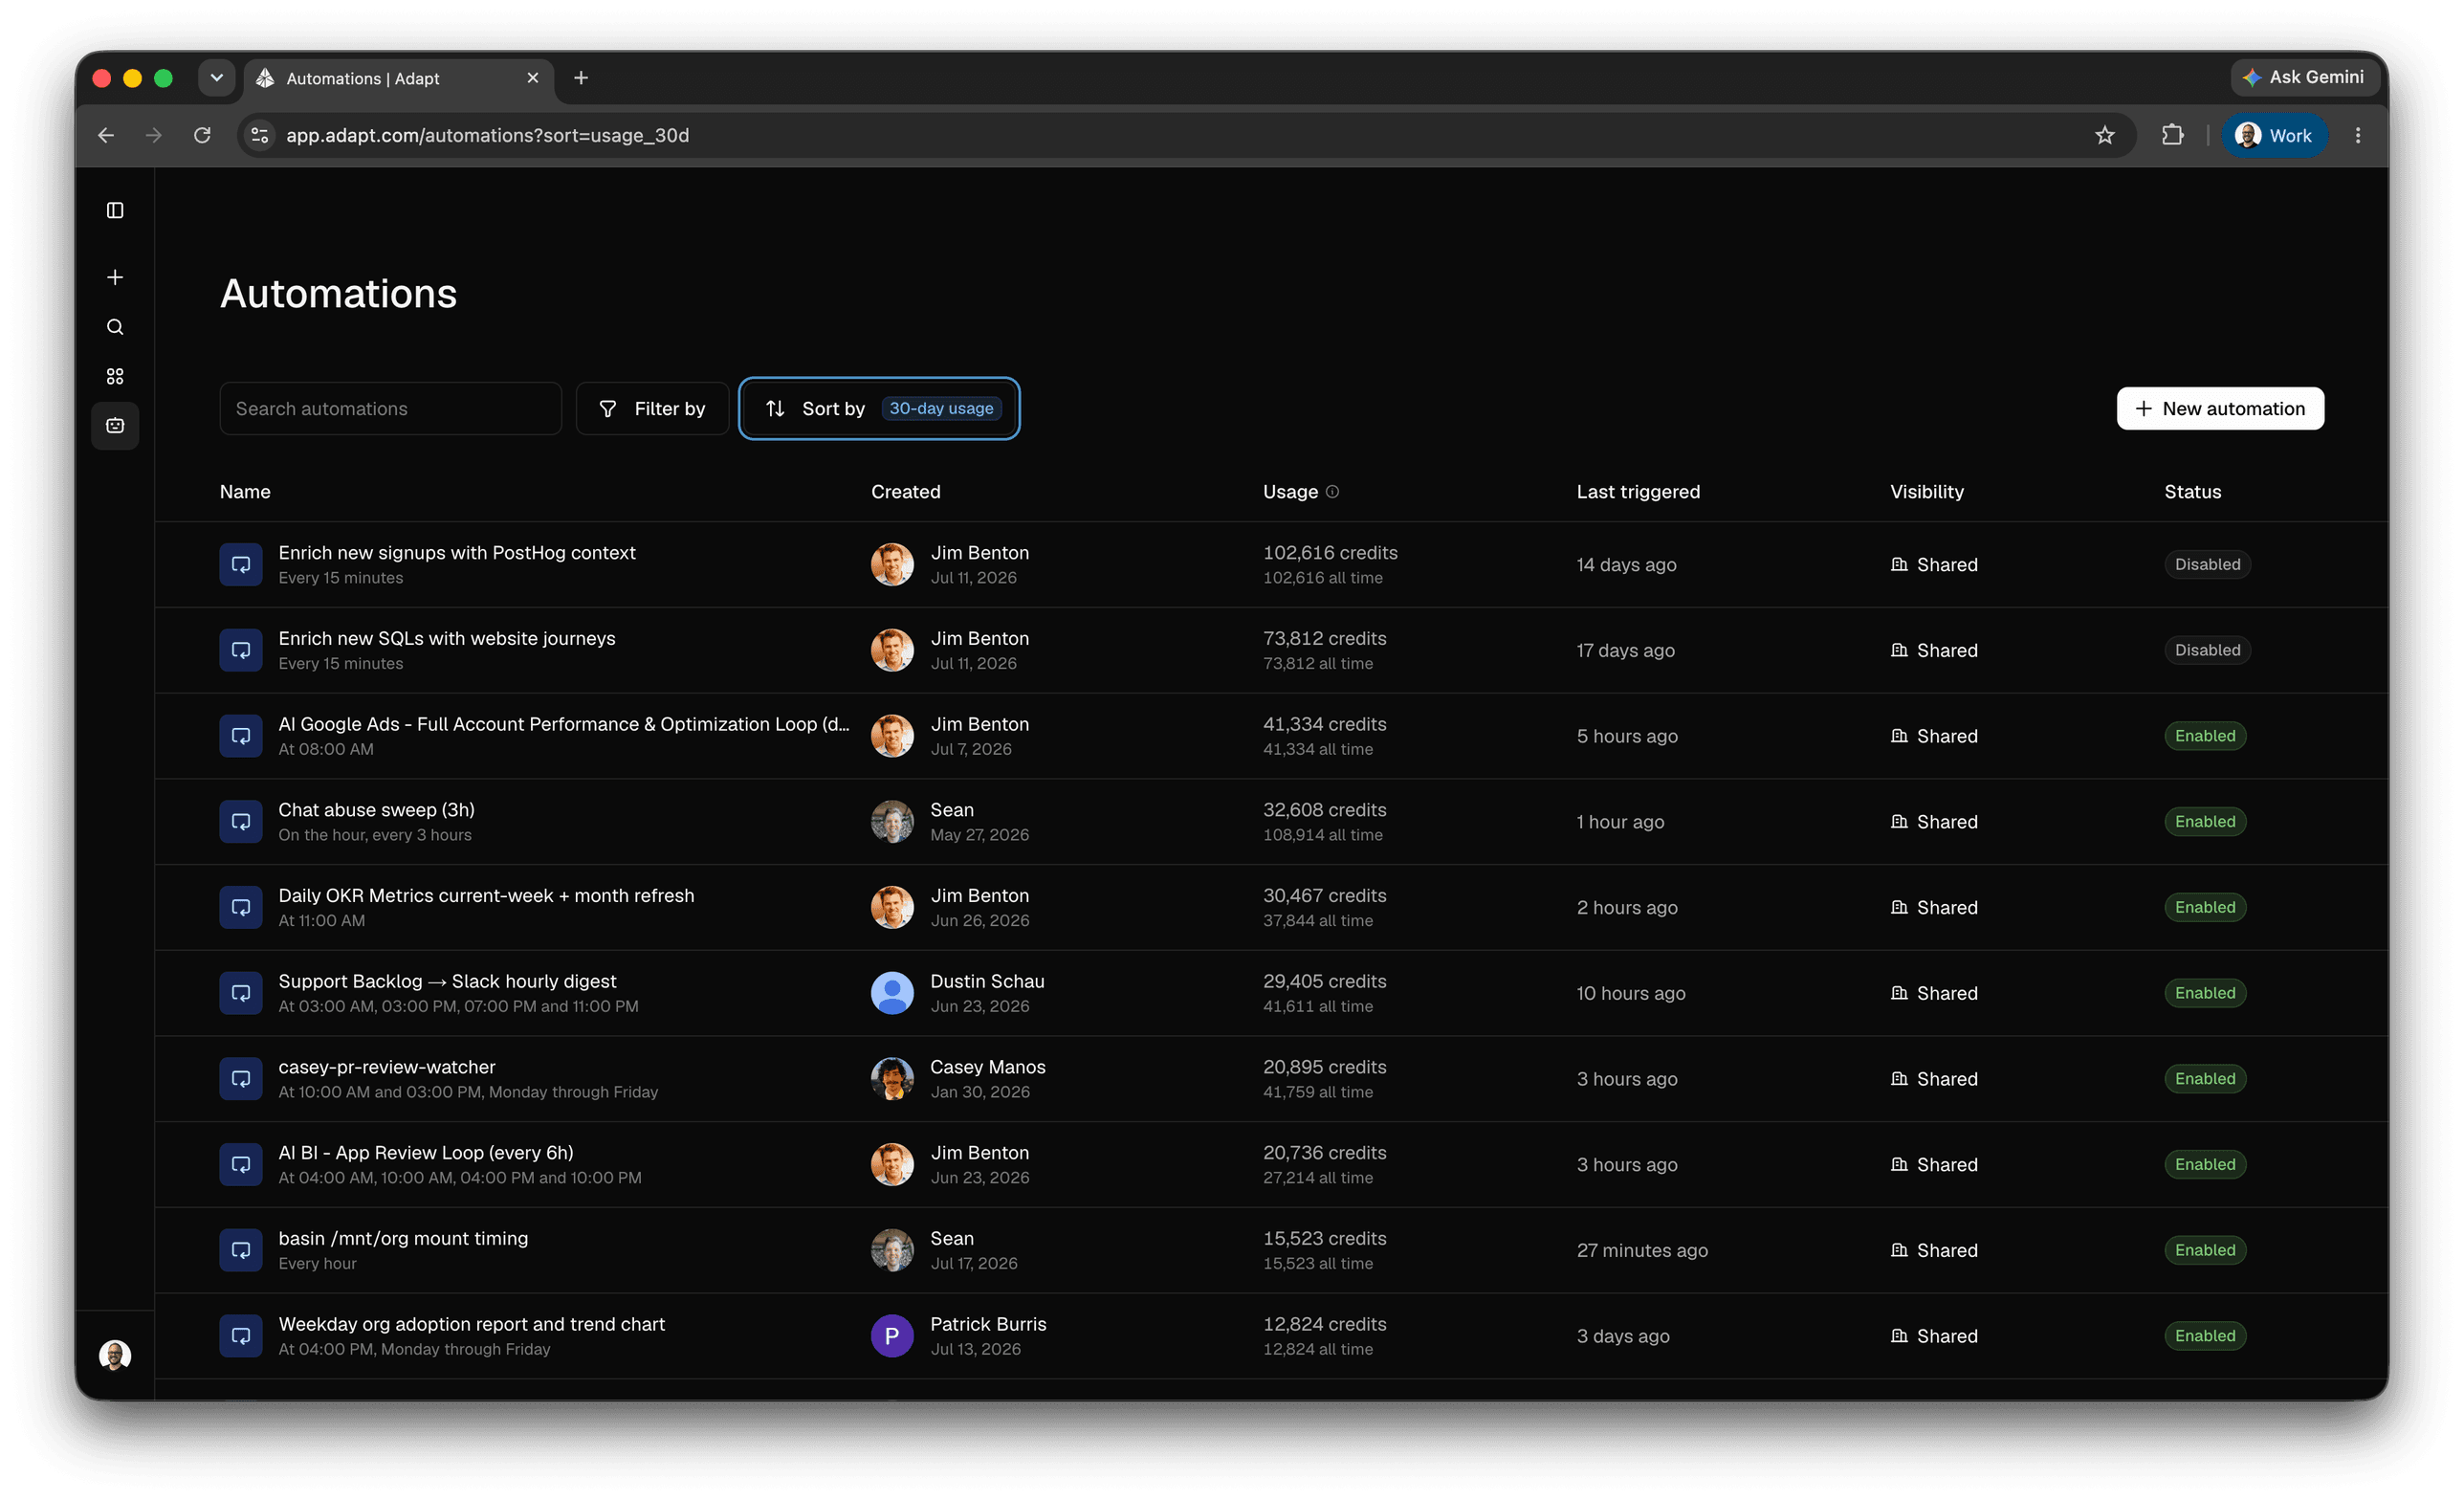
A Usage column shows credits consumed in the last 30 days, with the all-time total underneath. Automations that have never run read "No runs".
Sort by adds two new orders alongside Newest and Last run:
- Top usage (30 days) — what's burning credits right now
- Top usage (all time) — the heaviest spenders since they were created
Sorting applies to scheduled tasks and webhooks together, so a noisy webhook shows up next to a noisy cron job.
On each automation
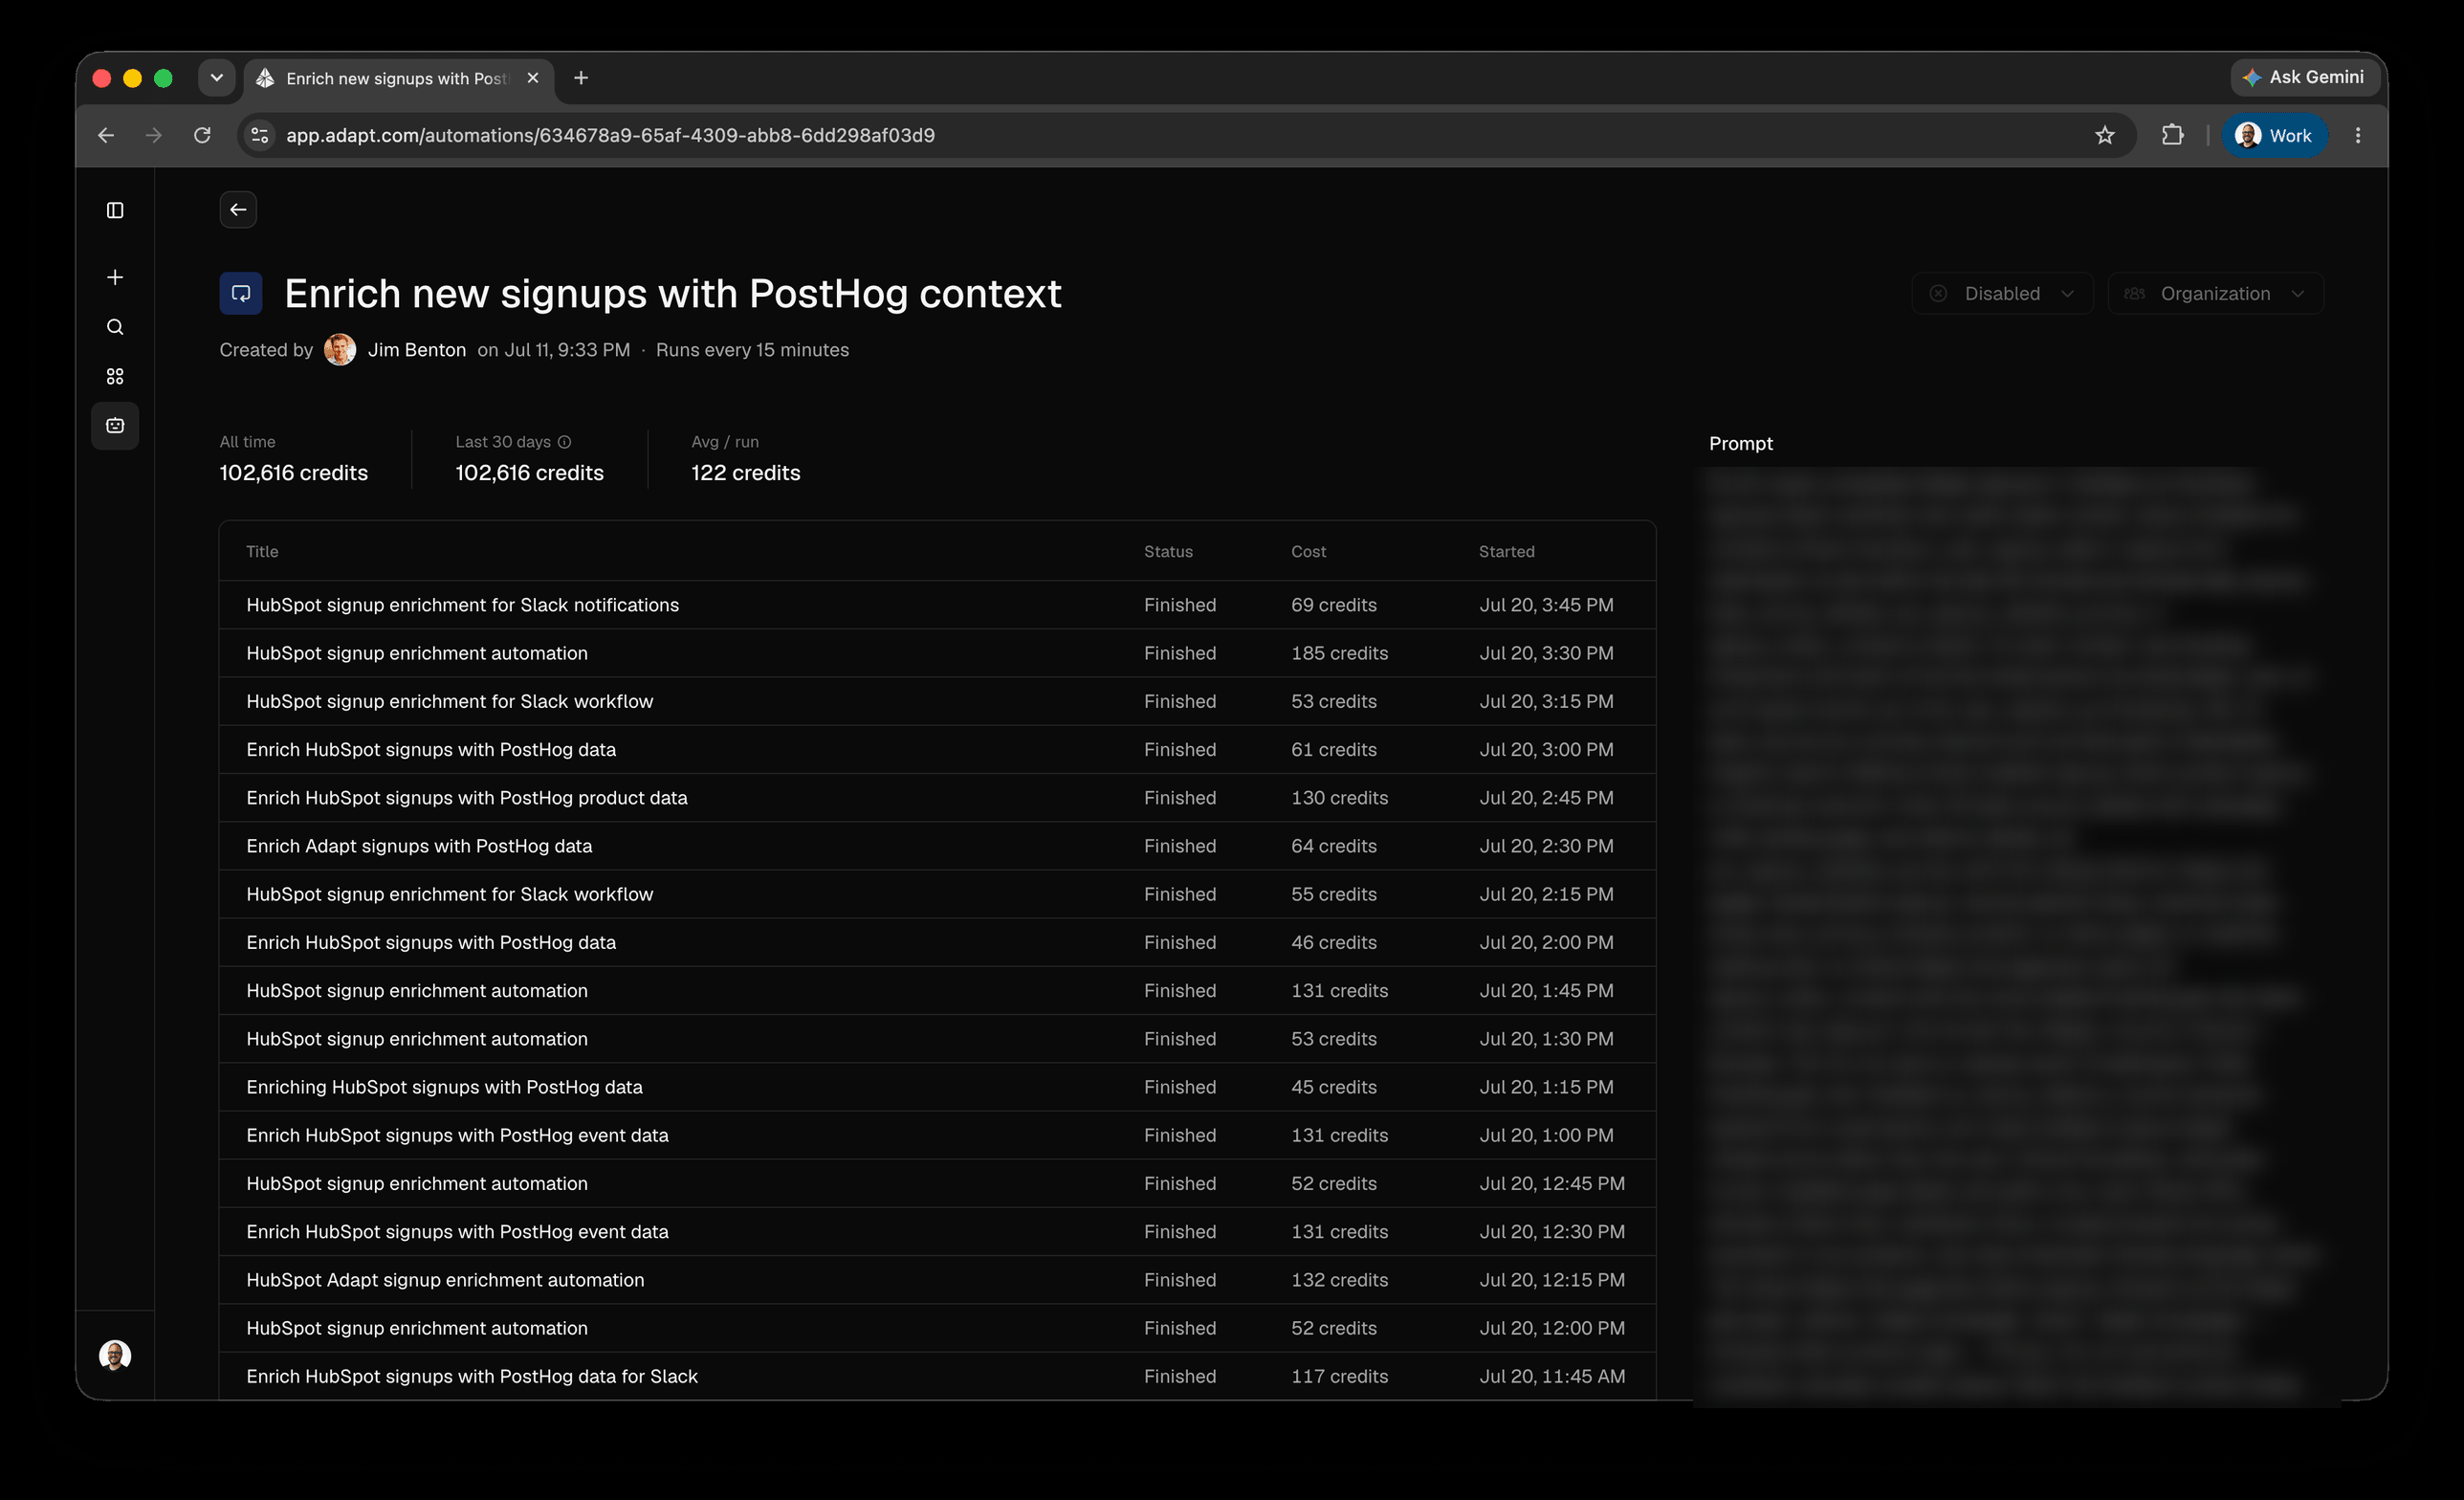
Open any automation and three numbers sit above its run history:
- All time — total credits the automation has consumed
- This cycle (or Last 30 days if you have no billing cycle) — credits in the current window, with the exact dates on hover
- Avg / run — all-time credits divided by the runs that incurred cost
The run history table now carries a Cost column, so a single expensive run stands out from the routine ones. Click the row to open that run's chat and see exactly what it did. Webhooks get the same treatment: their event history lists credits per delivered event.
Why it matters
A task set to every 15 minutes costs roughly 100x the same task set to daily. Until now that only showed up on your invoice. Now you can sort the list, find the top spender, open it, see whether the cost is concentrated in a few runs or spread evenly, and retune the cadence or the prompt.